MHCII3D is a tool for predicting MHC-II binding peptides, based on structural scaffolds of MHC-II-peptide complexes and statistical scoring functions (SSFs).
MHCII3D provides two modes:
- the scoring of peptides, and
- the scan of a protein sequence for binding regions
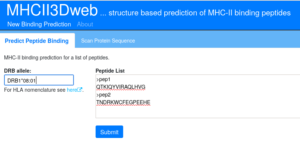
Scoring a list of peptides
For all prediction modes, first a HLA-DRB allele needs to be selected.
Then a list of peptides needs to be entered, either on peptide per line or in multi-fasta format.
Output
| Column | Meaning |
|---|---|
| Allele | Beta chain allele name |
| Peptide | Input sequence |
| Binding Sequence | Binding Sequence in the 15-mer peptide scaffold. ‘-‘ characters indicate that the peptide is shorter than the scaffold or shifted to the left or to the right. For clarity, the 9-mer core is indicated here in magenta. |
| Binding Score | SSF based score, the more negative the better |
| Binding Rank | normalized rank of the score in a random background ranging from zero (optimal) to one (worse than lowest scoring random peptide). |
| IC50 predicted | Rank converted to a IC50 value by non-linear fit |
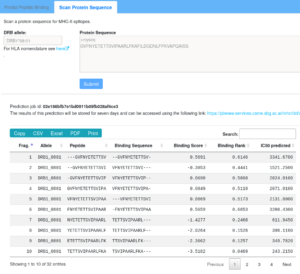
Scan a protein sequence for binding regions
Here, only a single sequence may be given, either as plain sequence or in fasta format. The input sequence is cut into overlapping fragments and each fragment is subsequently scored.
The meaning of the respective columns is described in the table above.
In addition, three plots are given, showing the average of the binding score, rank and IC50 per residue. Watch out for minima in these plots in order to locate binding regions (potential T-cell epitopes).


